Moving Average & Sector Frequency Diagram
Background
We are processing weather data, especially about wind direction distribution here.
Raw Data
import pandas as pd
import matplotlib.pyplot as plt
import matplotlib.dates as mdates
from scipy.interpolate import make_interp_spline
import numpy as np
# Load the data
df = pd.read_csv('wind_data.csv')
# Convert 'datetime' to datetime objects
df['datetime'] = pd.to_datetime(df['datetime'], format='\%Y-\%m-\%d')
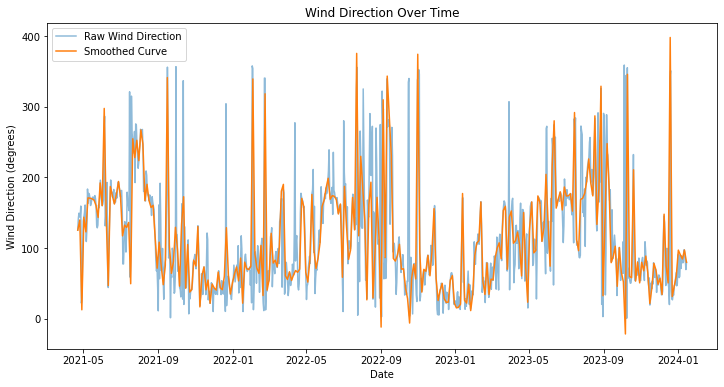
# Task 1: Plot the raw wind direction data as a smooth curve
plt.figure(figsize=(12, 6))
plt.plot(df['datetime'], df['winddir'], label='Raw Wind Direction', alpha=0.5)
# Creating a smooth curve
x_smooth = mdates.date2num(df['datetime'])
y_smooth = df['winddir']
# Assuming we want to smooth using a spline with a high number of points
spl = make_interp_spline(x_smooth, y_smooth, k=3) # Use a spline of degree 3
xnew = np.linspace(x_smooth.min(), x_smooth.max(), 300)
ynew = spl(xnew)
plt.plot(mdates.num2date(xnew), ynew, label='Smoothed Curve')
plt.xlabel('Date')
plt.ylabel('Wind Direction (degrees)')
plt.title('Wind Direction Over Time')
plt.legend()
plt.show()
Moving Average
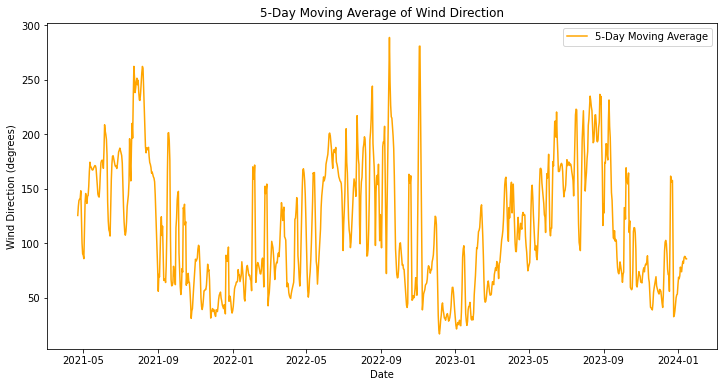
# Task 2: Calculate and plot the 5-day moving average
df['5_day_avg'] = df['winddir'].rolling(window=5, min_periods=1).mean()
plt.figure(figsize=(12, 6))
plt.plot(df['datetime'], df['5_day_avg'], label='5-Day Moving Average', color='orange')
plt.xlabel('Date')
plt.ylabel('Wind Direction (degrees)')
plt.title('5-Day Moving Average of Wind Direction')
plt.legend()
plt.show()
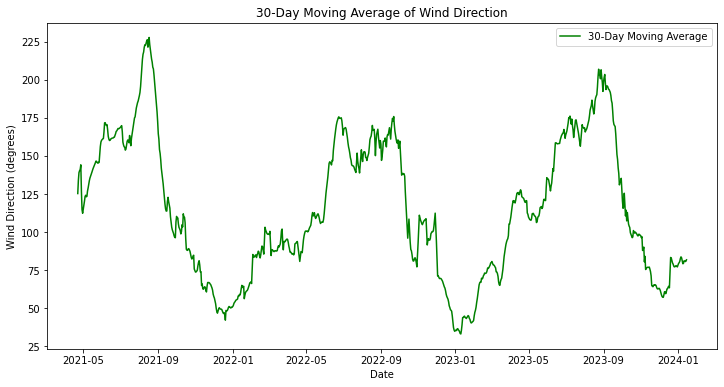
# Task 3: Calculate and plot the 30-day moving average
df['30_day_avg'] = df['winddir'].rolling(window=30, min_periods=1).mean()
plt.figure(figsize=(12, 6))
plt.plot(df['datetime'], df['30_day_avg'], label='30-Day Moving Average', color='green')
plt.xlabel('Date')
plt.ylabel('Wind Direction (degrees)')
plt.title('30-Day Moving Average of Wind Direction')
plt.legend()
plt.show()
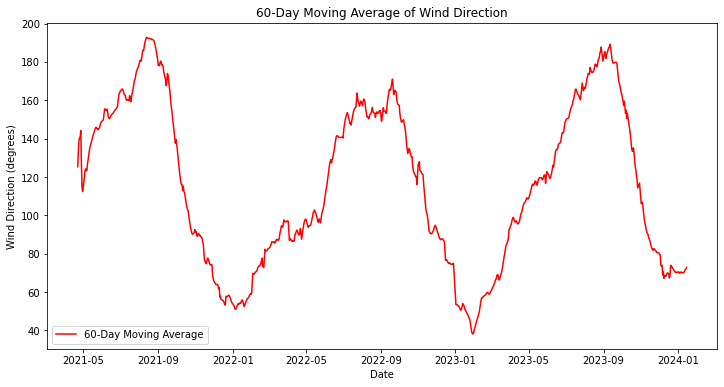
# Task 3.1: Calculate and plot the 60-day moving average
df['60_day_avg'] = df['winddir'].rolling(window=60, min_periods=1).mean()
plt.figure(figsize=(12, 6))
plt.plot(df['datetime'], df['60_day_avg'], label='60-Day Moving Average', color='red')
plt.xlabel('Date')
plt.ylabel('Wind Direction (degrees)')
plt.title('60-Day Moving Average of Wind Direction')
plt.legend()
plt.show()
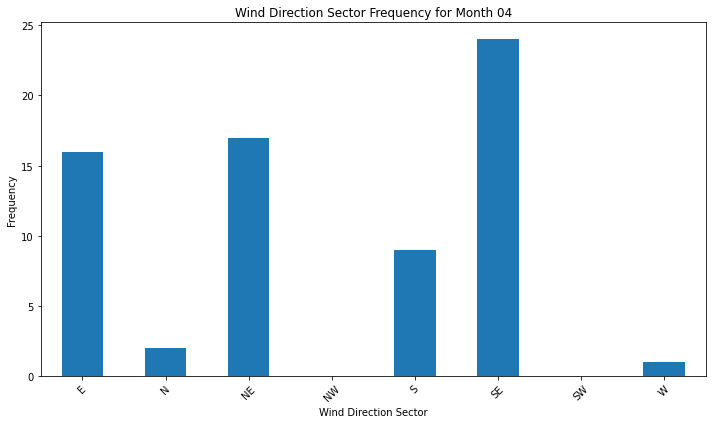
Sector Frequency Diagram
# Define the sector boundaries
sectors = {
'N': (337.5, 22.5),
'NE': (22.5, 67.5),
'E': (67.5, 112.5),
'SE': (112.5, 157.5),
'S': (157.5, 202.5),
'SW': (202.5, 247.5),
'W': (247.5, 292.5),
'NW': (292.5, 337.5)
}
# Function to categorize each wind direction into a sector
def categorize_direction(degrees):
for sector, (lower, upper) in sectors.items():
if lower < upper:
if lower <= degrees <= upper:
return sector
else: # Overlap case for North sector
if degrees >= lower or degrees <= upper:
return sector
return 'Unknown'
# Apply the categorization function to the wind direction data
df['sector'] = df['winddir'].apply(categorize_direction)
# Group by month and sector and count the occurrences
df['month'] = df['datetime'].dt.month
monthly_sector_counts = df.groupby(['month', 'sector']).size().unstack(fill_value=0)
# Plot the sector frequency diagram for each month
months = df['month'].unique()
for month in months:
plt.figure(figsize=(10, 6))
monthly_sector_counts.loc[month].plot(kind='bar')
plt.title(f'Wind Direction Sector Frequency for Month {month:02d}')
plt.xlabel('Wind Direction Sector')
plt.ylabel('Frequency')
plt.xticks(rotation=45)
plt.tight_layout()
plt.show()
To name a few
Last modified: 06 February 2024